Population Health Analytics
Beyond Frailty: How Broader Segmentation Can Improve Care for High-Risk Patients
|
Population Health Management & Improvement |
Risk Stratification & Population Segmentation


In the UK and globally, frailty has become a common lens for identifying high-need patients — particularly older adults. But does frailty alone give us enough information to target care effectively?
How do we define frailty?
Frailty can be hard to define — even among experts. A group of clinicians and geriatricians across the U.S. and UK seem to agree that frailty is “an aggregate expression of risk based on the presence of multiple diseases or physiological deficiencies”.i The presence of a single disease is not enough to define ‘frailty’, and it can look different from patient to patient.
Frailty often overlaps with multimorbidity and disability, but each is a distinct condition. Frailty and multimorbidity are both risk factors for disability — when a person struggles with daily tasks like getting dressed or eating. In turn, disability can worsen frailty and make chronic conditions harder to manage. As the number of chronic conditions increases, so does the chance of developing frailty.
Can frailty alone really predict cost and emergency risk?
Frailty is associated with increased health care costs and higher emergency admission rates — but it doesn’t provide a comprehensive view of an individual’s risk. Other dimensions, including clinical complexity, health care utilization and social determinants of health are key to forming a complete picture.
One real-world example: In the UK’s Slough CCG (now part of Frimley ICS), using the Johns Hopkins ACG® System to segment the population by multimorbidity and other risk factors — not just frailty — identified a wider group of impactable patients. The result? Fewer hospitalizations, lower emergency department use and meaningful cost savings.
Costs and resource use increase as frailty increases, but not all frail patients are high-cost — and not all high-cost patients are frail.
Are we missing high-risk patients by focusing only on severe frailty?
Based on the experience of Slough CCG, 46% of the population at high risk of hospitalization or elevated cost would have been missed if they focused only on those with severe frailty. That’s why it’s critical to expand beyond traditional frailty markers — to identify those most likely to benefit from proactive intervention.
How do the different frailty indices compare?
The Rockwood Scale is commonly used in the UK to clinically measure individual patients’ degree of frailty and is a direct clinical assessment of observed frailty.
The Electronic Frailty Index (eFI) is also used to identify frailty in populations, and is a proxy score based on multiple frailty deficits captured from primary care data and then grouped into risk categories.
The ACG System also includes a frailty marker, which offers a proxy measure, aggregating multiple frailty concepts identified through primary and secondary care data.
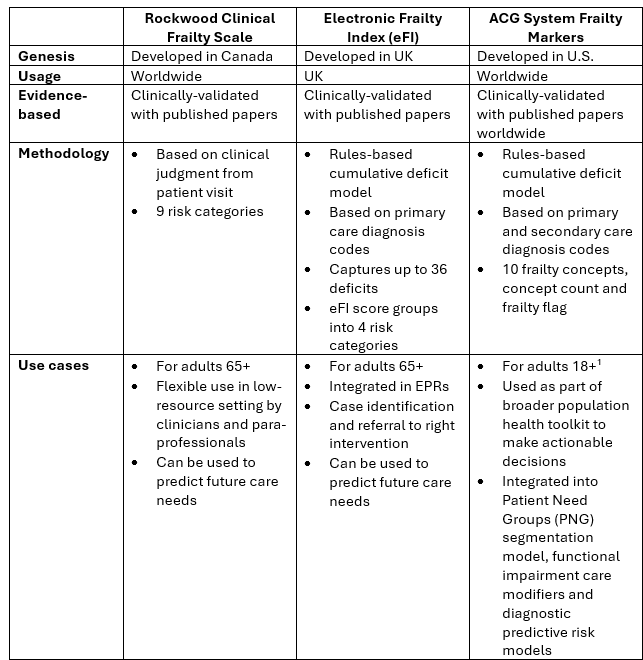
1 Note: the ACG System’s PNG frailty category includes individuals aged 65+, while the frailty marker itself (outside of PNGs) includes individuals aged 18+.
While traditional indices often emphasize physical decline, broader segmentation methods incorporate a wider range of variables that influence outcomes — offering more actionable insights for population health teams.
How does segmentation help us target care more effectively?
Frailty scores are valuable, but they’re just one part of the story. Pairing frailty with data on comorbidities, utilization patterns and social needs can lead to more effective and impactful care.
Another key consideration is data completeness. For example, a frailty diagnosis recorded in a hospital might not be captured in primary care records — and therefore might be missed by the eFI. The Rockwood score is comprehensive, but it is a subjective measure and only available when a clinical provider assessment has taken place.
Segmentation bridges these gaps. It looks across all data sources and provides a more nuanced view of patient risk, considering factors such as multimorbidity, social determinants and patterns of health care use.
How does the ACG System’s segmentation model work?
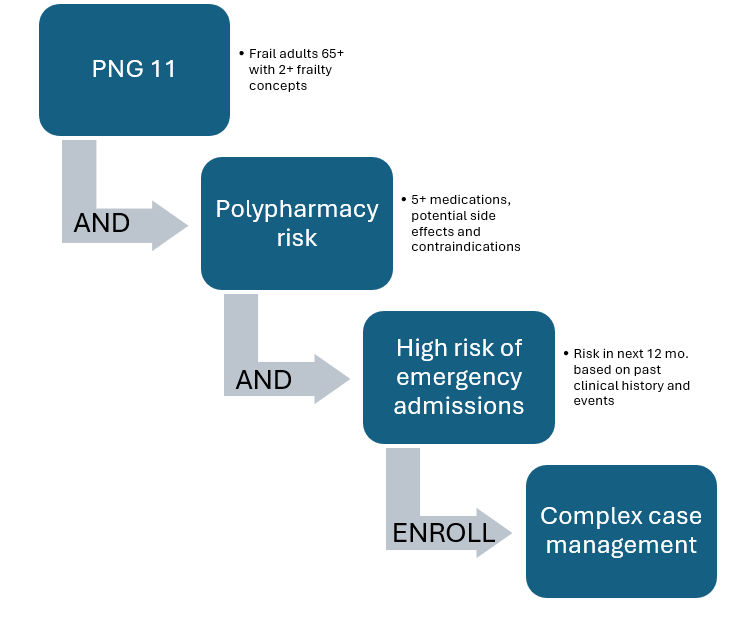
The ACG System uses an innovative, clinically based segmentation framework called PNGs. Every individual is assigned to one of 11 exclusive groups based on their health status, complexity and modifiable risk factors.
For instance, if you’re looking at a group of patients in PNG 11 (adults 65+ with multiple frailty concepts), segmentation can help you drill deeper. Are they all high-risk? Not necessarily. Some might have a polypharmacy risk with certain medications causing dizziness and increasing the risk of falls. Further risk stratification might identify a sub-set of this population that is high-risk due to other comorbidities. These more complex patients could be seen by a complex case manager while the lower-risk segment might be better supported through pharmacist-led medication reviews. The goal is to match clinical resources to patient need more precisely.
Final thoughts
Frailty tools have useful applications — but a broader population segmentation approach enables health care organizations to take a more holistic view and match the right patients to the right care programs based on their overall needs.
By identifying those who are truly at the highest risk as identified by segmentation, risk stratification and impactable risk factors — rather than relying solely on frailty markers — organizations can allocate resources more effectively, improve patient outcomes and reduce avoidable costs.
It’s clear that frailty is closely connected to other clinical conditions, many of which result in higher resource use and hospitalization. Segmenting the population into distinct categories can contribute to a more personalized approach to prevention and tailored treatment plans, focused on individuals’ actual needs.
The ACG System brings all of these elements together — segmentation, frailty markers, social needs and more — in a single, integrated solution. It’s a powerful analytic platform for identifying risk and making smarter care decisions.
Learn more:
- Rockwood Clinical Frailty Scale
- Electronic Frailty Index (eFI)
- Johns Hopkins ACG System Frailty Markers
- Slough Case Study (Frimley ICS)
Other blog posts on PNGs:
To learn more about how the ACG System can support your organization, visit hopkinsacg.org or contact us at acginfo@jh.edu. If you are a current ACG System customer, please reach out to your Account Manager.
i https://pubmed.ncbi.nlm.nih.gov/15031310/
Sign up for blog alerts and other insights from the ACG System team
Follow Us