Population Health Analytics
How the ACG System Can Aid Users in Managing Pediatric Populations


While the Johns Hopkins ACG System can be used for whole population analytics of disease prevalence, chronic condition markers, pharmacy adherence, prediction of cost and more, the System is also used across the world to specifically assess pediatric populations.
In fact, the ACG System is a product of the research done by Johns Hopkins University distinguished professor Barbara Starfield, M.D., M.P.H. and her colleagues, who were assessing the relationship between morbidity (or illness burden) and health care services utilization among children in managed care settings. Their research showed that children using the most health care resources were not those affected by a single chronic illness, but rather they had multiple, seemingly unrelated health conditions. These findings and methodology were then extended to patients of all ages, and ultimately demonstrate that the clustering of morbidity is a better predictor of resource use than the presence of specific diseases. Thus, the foundation for the ACG System was born.
In this post, we will discuss a couple of examples of how the ACG System can be used to assess these pediatric populations to manage utilization and cost, and implement care management strategies.
Simple Filtering
The simplest way of assessing a pediatric population is using the standard ACG System reports, such as the Emergency Department Visit Classification report. Users can simply filter on age to achieve this goal. In addition, since the ACG’s (Adjusted Clinical Groups®) and ADG’s (Aggregated Diagnosis Groups) have exclusive categories for pediatrics, one can also focus on a subset of pediatrics, say those with chronic conditions, in order to develop care management strategies for this particular sub-group.
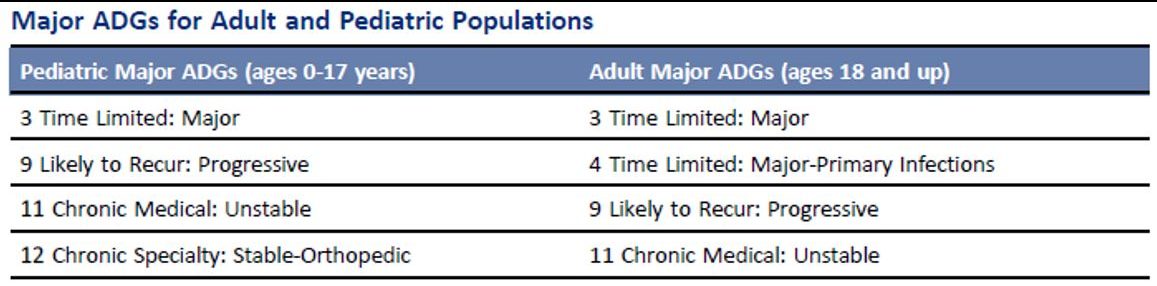
Major Aggregated Diagnosis Groups (ADG’s)
ADG’s are the first step in ACG grouping logic and assign diagnosis codes to one or more of 32 diagnosis groups, which are all based on the duration, severity, diagnostic certainty and etiology of the condition. Each of these diagnosis groups help guide users in understanding who is utilizing the most resources. These are further broken down into major ADG’s, where important definitional differences were incorporated between pediatrics and adults. Below is a table with examples of ADGs.
While this is generally used as a means for collapsing diagnosis, it can also be used as a risk assessment tool for any user that may be interested in pediatric populations in particular.
Risk Assessment and Prediction
In addition to ADG’s, users can exclusively use pediatric populations in concurrent risk scoring within the ACG System. When users run the All Age model, pediatric populations (ages 0-17) will have their own set of predictive outcomes. Users will be able to see prevalence rates compared with the reference population, along with utilization markers and resource utilization bands.
In summary, everything that the ACG System has in place today started with the goal of understanding risks in the pediatric population. The ACG System then grew into the comprehensive population health analytics tool it’s known as today.
To learn more about the ACG System and how it can help you assess your pediatric population, email acginfo@jh.edu or speak with your account manager directly.
Sign up for blog alerts and other insights from the ACG System team
Follow Us