Population Health Analytics
Casemix Adjustment: How one city in England used the ACG System to address misplaced initiatives, wasted time and miscommunications between providers and payers


The Challenge
The city of Leicester, England has been using the Johns Hopkins ACG® System since 2012 to help them to understand the health of their population.
Over the last couple of years, the team in Leicester have been trying to understand the variation in the use of secondary care services from their primary care providers’ populations, but this has been difficult using traditional analytical techniques. They were finding that parameters – such as total secondary care cost, rates of attendance at the emergency department (ED) and emergency admissions (unplanned hospitalizations) – could be explained to a certain extent when combined with known variables such as variations in age/sex distribution or degrees of multiple deprivation. But because they were unable to quantify these variations, much remained inexplicable.
This information gap was leading to misplaced initiatives, wasted time and miscommunications between providers and commissioners (payers). For this reason, the team decided to use a casemix adjustment approach to get to the bottom of the issue.
The Solution
The team decided to use data from the ACG System to casemix adjust their primary care provider activity and cost data.
By considering the full range of diagnoses and their widely variable combinations, as well as age and sex, the ACG System enabled the team at Leicester to unpick the variability, making sense of data that previously defied explanation. This analysis allows a much more nuanced view of their provider costs than merely taking an average (£302 in the below chart).
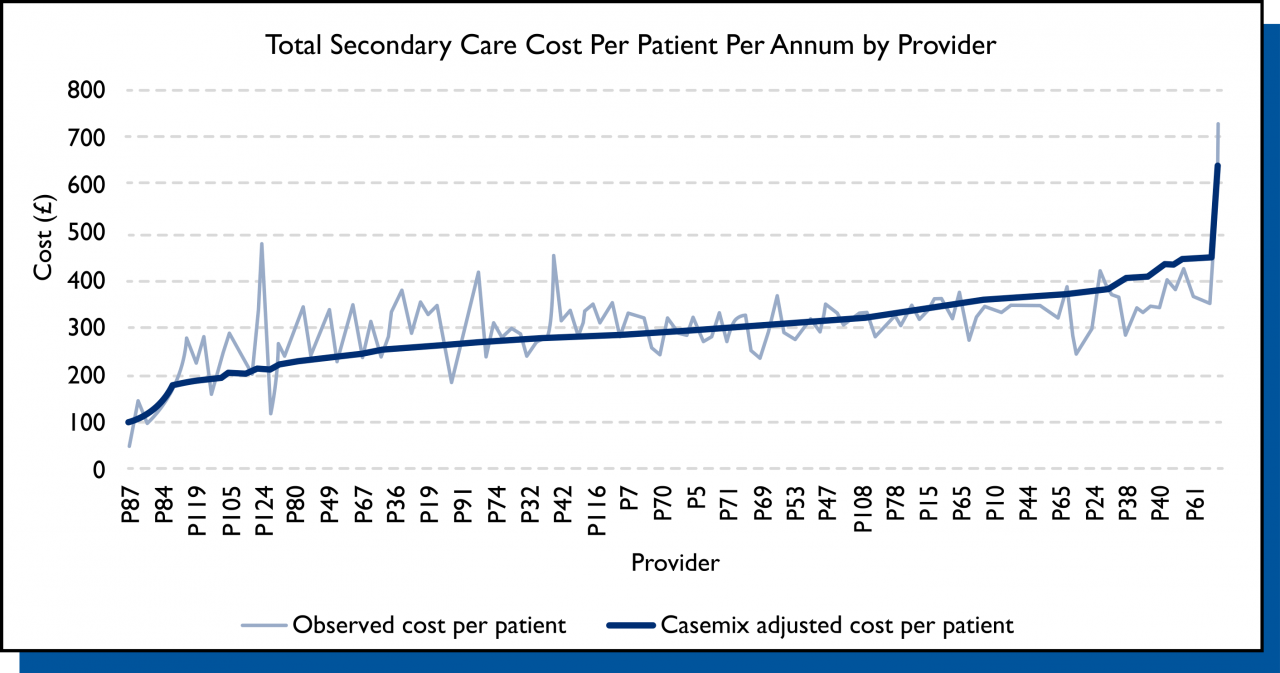
The new approach now provides data relating to the expected level of cost per patient and the observed or actual level of cost. This allows for exploration of why observed cost varies between providers with similar expected cost, having removed age, sex and casemix as possible explanations.
Dr. David Shepherd, Advisor on Health Informatics and Population Health, LLR Clinical Commissioning Group, explains, “We found that two primary care providers, one serving a deprived area and another not, had similar costs. Casemix adjustment helped us understand how the similarity arose from different causes: one had an older population with an age-related illness distribution, and the other had a different illness distribution in a younger but deprived population with more mental health issues. Therefore, the cost similarity was genuinely justified. We could now see how and why this came to be, whereas before it was a mystery. It will also give us insight into the commissioned service changes which best support our primary care providers to meet the needs of their populations.”
During the project, the team noticed the quality and completeness of coding varied between primary care providers, which could distort the case-mix calculations. The team modelled the effects of this variation on casemix to compensate for it. They also worked to decrease coding variations by highlighting the issue locally and writing a handbook of clinical coding and record-keeping for their Electronic Health Record. With support from NHS England, this handbook has been developed into an audio-visual resource.
The casemix adjustment work has contributed to improving the feedback that the Leicester team gives to their providers on their activity rates. Dr. Shepherd notes, “Previously, reports merely compared month on month, which led to the chasing of random variation. We now report using Statistical Process Control charts, with run-time data for two years. Alongside this we are able to present the casemix adjusted expected run rate.”
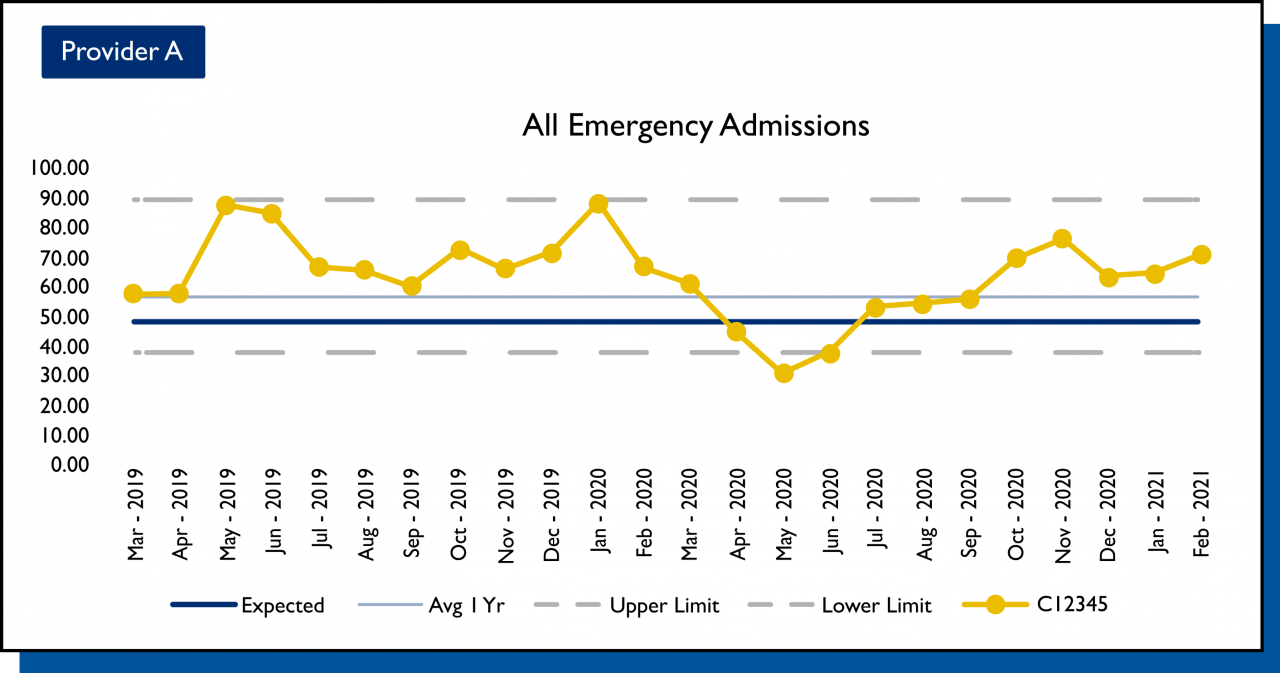
The enhanced charts now allow providers to select special cause variation (for example, COVID-19) from their usual activity rate. In addition, the charts indicate whether their average activity is in line with what is expected – based on a casemix adjustment – using all providers’ data. This enables a much more constructive discussion with providers on variation.
Locality GP lead, Dr. Rowan Sil, used the casemix adjusted data from the ACG System to support those GP practices (primary care providers) that were showing unexplained variation in unplanned hospitalizations and ED attendance. Dr. Sil and colleagues visited various GP practices to explore the data and the issues that may have been underlying the variation. Dr. Sil said, “What the casemix adjusted data enabled was targeted, clinically-led conversations to identify the areas of need, so we could put in the support to solve problems.”
Conclusion
The developments at Leicester are helping to support commissioners and primary care providers alike in avoiding inaccurate conclusions that can be drawn from unadjusted data.
To read the full case study, click here.
Sign up for blog alerts and other insights from the ACG System team
Follow Us